
Product
Teminops plugins: see what's wrong with a server in seconds, not ten SSH commands
Every sysadmin has a muscle-memory routine for a sick server: uptime, sar, systemctl --failed, df -h, kubectl get pods… Teminops plugins turn that routine into a few clicks, on any host you've already added, without installing anything on it.
01The 3 a.m. routine
An alert fires: "payments-api is slow." You SSH in and start the ritual. Is the load high? When did it start? Is it CPU, memory, disk or network? Did a service crash? Is a disk filling up? If the app runs on Kubernetes or OpenShift, are the pods healthy?
Each question is a command, sometimes with a flag you have to look up (sar -f /var/log/sa/sa11 -r, anyone?). The output is raw text you have to read line by line, often across several servers. None of it is hard, but it's slow, it's repetitive, and it's exactly when you're most tired that you skip a step.
Teminops plugins package that routine into views you can open on any host in one click. They read the same data you would, over the same SSH connection, and present it as charts, counts and tables you can act on.
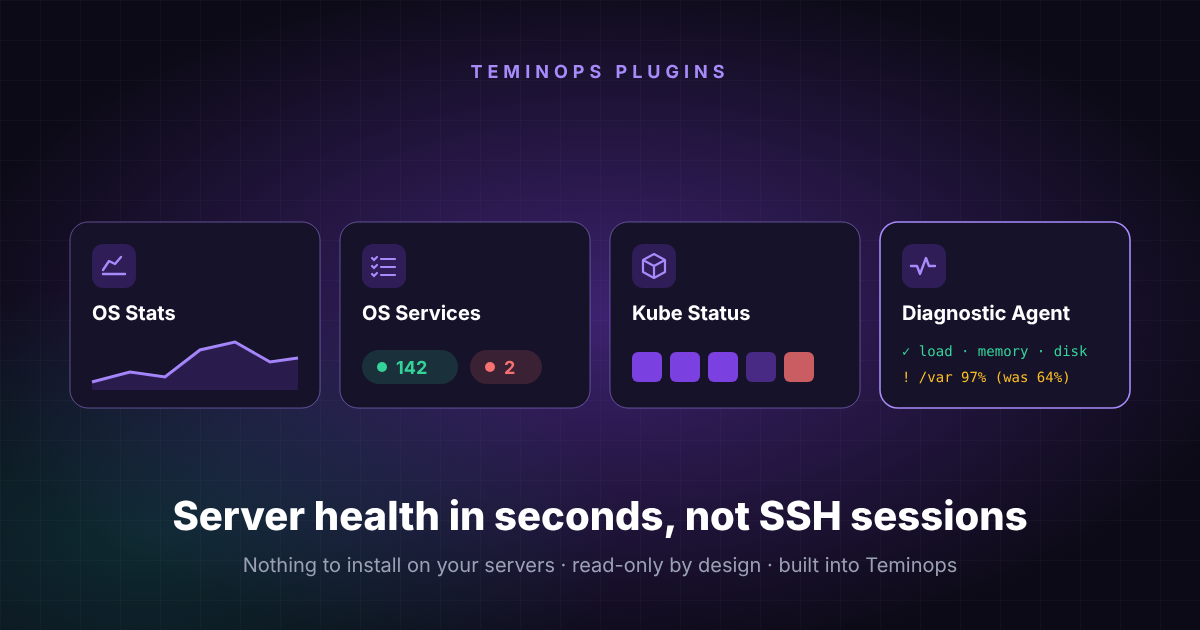
OS Stats (sar)
CPU, memory, swap, disk and network history as charts, for any day the host has kept.
OS Services
Running, failed and other systemd services at a glance, with filter and search.
Kube Status
Nodes, projects and workloads, logs, events and shells, through the host's own kubectl or oc.
Diagnostic Agent
An AI agent runs a full health check, digs into anything abnormal and writes up what it found.
02How plugins work
Plugins are built into Teminops. Turn on the ones you want in the Plugins panel, then right-click any host and choose Plugins → OS Stats, OS Services, Kube Status or Diagnostic Agent. Each opens in its own tab next to your terminal.
- Nothing to install on your servers. No agent, no daemon, no open port. Plugins use tools that are already there:
sarfrom sysstat,systemctl, and the host's ownkubectloroc. - Uses your existing access. Plugins run as the user you logged in as, so they see exactly what you could see by typing the commands yourself.
- Per host. Open OS Stats on one server, Kube Status on a bastion host, and the Diagnostic Agent on a third, side by side.
- Helpful when something's missing. If a host doesn't have sysstat, OS Stats tells you, and shows the exact install command for that distro's package manager.
03OS Stats (sar): performance history you can actually read
Most Linux servers already record performance data every few minutes through sysstat. It's one of the most valuable and least used tools in a sysadmin's kit, because reading it means remembering flags and scrolling through columns of numbers.
OS Stats reads that history and draws it as charts:
- CPU: user, system, I/O wait and idle over the day.
- Memory and swap: usage over time, so a slow leak is obvious.
- Disk: per-device activity and utilisation.
- Network: per-interface traffic.
- Any day the host has kept: pick a date to see what happened last Tuesday, not just right now.
- Reboots marked: restarts show up on the timeline, so you can tell a crash from a planned reboot.
- Export graphs to drop into an incident report or a capacity review.
top can't answer it; sar history can, and OS Stats makes it a two-click answer.04OS Services: what's running, and what isn't
A modern Linux server runs well over a hundred systemd units. systemctl --failed tells you what has crashed, but not the full picture, and the output is hard to scan.
OS Services shows the whole picture at once:
- Summary cards for all, running, failed and other services. Click a card to filter the list.
- Failed services stand out, so a crashed unit after a reboot or a package update is the first thing you see.
- Search by name or description to find a service quickly (nginx, postgres, chronyd…).
05Kube Status: your cluster, from the host you already use
Many teams manage Kubernetes and OpenShift from a bastion or jump host that already has kubectl or oc and a kubeconfig. Kube Status works through that host, so it needs no new credentials, no API endpoint exposed to your laptop, and no extra firewall rule.
- Finds the tools automatically. Teminops detects
ocorkubectlon the host, including binaries added to your PATH in.bashrc, and lets you choose between kubeconfig contexts. Views can refresh automatically. - Cluster health first. A summary of nodes, pods and persistent volumes, plus the cluster operators on OpenShift, shows at a glance whether anything is degraded.
- Browse everything. Nodes, namespaces or projects, and workloads, including custom resource types (for example OpenShift Routes or Istio VirtualServices) that the plugin discovers on the cluster.
- Inspect quickly. Open describe with recent events, or the YAML. Secret values stay hidden until you explicitly choose to reveal them.
- Logs. Tail recent lines, view the previous container's logs after a crash loop, or follow logs live.
- Resource usage with
topfor nodes and pods. - Shell access into a container, or a debug shell on a node, opened right inside Teminops.
oc and shows cluster operators in the health summary, so a degraded operator after an upgrade doesn't go unnoticed.06Diagnostic Agent: a thorough health check, written up for you
The Diagnostic Agent is an AI that investigates a host the way an experienced engineer would. By default it works through an eleven-point health check:
| Area | What it checks |
|---|---|
| Load & CPU | Load averages, CPU activity, and the processes using the most CPU. |
| Memory & swap | Usage and pressure, the biggest memory users, and which processes are swapping. |
| Disk | Filesystems close to full, disk I/O and device utilisation. |
| Hidden disk usage | Deleted files still held open by a process: space that df counts as used but nothing on disk accounts for. |
| Network | Listening ports and connection states. |
| System logs | Warnings and errors, out-of-memory kills, and "no space left on device". |
Then it goes further, which is where an agent differs from a script:
- It digs into anything abnormal. If one process dominates CPU, the agent checks its full command line, how long it has been running and whether it looks expected, before it reports.
- It compares with the last run. Key numbers such as load, disk, memory and swap are compared with the previous check on the same host, so "disk went from 61% to 94% since yesterday" is called out.
- It keeps a history per host. Every run is saved, so you can see how a server has changed over time.
- It writes a report. Export the findings as a PDF for an incident ticket, a change record or your manager.
- You can stop it at any time if you've already seen what you need.
07An example troubleshooting session, start to finish
Back to the alert: "payments-api is slow." Here's how it might play out with plugins:
- OS Stats on the app serverThe CPU chart shows a jump in I/O wait starting at 13:40. Memory is flat, so it's not a leak.
- OS Services on the same hostTwo failed units:
payments-workerandlogrotate. A failed log rotation alongside high disk I/O is a strong clue. - Diagnostic AgentIt confirms
/varis 97% full, up from 64% at the last check, and finds a 40 GB log file that was deleted but is still held open by the worker process. - Kube Status on the bastion hostThe API pods have restarted three times. Their previous container logs show write errors on the shared volume, which confirms the cause.
- Fix and recordYou approve the agent's proposal to restart the worker, which releases the space. Then you export the agent's PDF and attach it to the incident ticket.
The same steps by hand mean a dozen commands across two servers, and remembering every one of them under pressure. With plugins, the evidence is already gathered and on screen.
08Safe to use on production servers
Plugins are designed for the servers you care most about:
- Read-only by design. OS Stats, OS Services and the inspect views in Kube Status only read data. Changes happen only when you choose to make them.
- Nothing to install. No agent running on your servers means nothing extra to patch, monitor or justify to security.
- Strict input checks. Every value Kube Status passes to
kubectloroc, such as a namespace, resource name or kubeconfig context, is checked against a strict allow-list, so it can't be abused to run something else. - Built in, not downloaded. Plugins are part of the signed Teminops app. There's no third-party plugin marketplace to vet.
- Your permissions, nothing more. Plugins act as your SSH user and your kubeconfig identity, so existing access controls and audit trails still apply.
09Getting started
- Open the Plugins panelClick the Plugins icon in the Teminops sidebar. Plugins are included in Teminops Pro.
- Turn on the plugins you wantEach one has its own switch, so enable only what your team uses.
- Right-click a host → PluginsPick OS Stats, OS Services, Kube Status or Diagnostic Agent. It opens in a new tab and connects if needed.
Tip: for OS Stats, make sure sysstat is collecting on your servers (sudo systemctl enable --now sysstat). If it isn't installed, the plugin shows the right install command for that distro.
Spend less time gathering evidence, and more time fixing
Teminops brings your servers, your terminal, AI help and these plugins into one secure desktop app.
Try Teminops See Pro plans